
Concrete owners do not need another laboratory number without context. They need to know whether sealing has remained useful on real concrete, under weather and salt, years after application.
Three long-term field studies help answer that question. Together, they support concrete sealing as a maintenance strategy—not a permanent, one-time barrier. Product-specific laboratory work from Construction Materials Testing and Iowa State University then shows how SIP-1133™ treated specimens compared with untreated concrete.
What long-term field studies show
The strongest evidence compares treated and untreated concrete exposed to the same real-world conditions and returns years later to measure what changed.
| Study setting | Follow-up | Comparison | Practical lesson |
|---|---|---|---|
| Wisconsin concrete pavement joints | 8.2 years | Sealed and unsealed joints | More than half of the sealed joints still showed better contact-angle and absorption performance. |
| Suspended tunnel ceiling | 12 years | Hydrophobically treated and untreated surfaces under the same exposure | Embedded resistivity and reinforcement-corrosion monitoring supported a lasting treatment effect and the importance of application quality. |
| Nine bridge decks | 12–16 years | Treatment schedules and untreated controls | Periodic tri-siloxane reapplication reduced surface chloride and apparent diffusion; construction-only application without reapplication did not improve long-term chloride ingress. |
These studies did not test SIP-1133™ and do not establish a SIP-1133™ service life. They establish field evidence for the maintenance strategy and show why application quality, inspection, and reapplication matter. The CMT and Iowa State work below addresses the product-specific question: how did SIP-1133™ treated specimens compare with untreated concrete in laboratory testing?
Why the field results make sense
Water and dissolved salts move through concrete’s pore network. In cold climates, that exposure contributes to salt scaling and freeze-thaw damage. In reinforced concrete, chloride movement can also bring the steel closer to corrosion. Peer-reviewed studies of other sealer chemistries show that slowing those pathways can improve the durability indicators used to estimate service life.
- Li and colleagues (2020) tested silane and organosilicone treatments during salt-frost cycling. For the concrete mixture highlighted by the authors, the silane treatment reduced water absorption by 89.9% and increased cycles to the study’s failure criterion by 42%. The organosilicone treatment reduced absorption by 75.7% and increased cycles by 25%.
- Liu and colleagues (2024) studied a nanoscale deep-penetrating sealer. At the highest application level, the treatment reduced the chloride diffusion coefficient by about 35% for one tested concrete mixture and reduced the capillary-absorption coefficient by about 57% for another.
- Zeng and colleagues (2020) modeled the corrosion-free service life of silane-treated concrete and validated the model against on-site exposure data. Their analysis supported a service-life extension while warning that simplified assumptions can overstate the gain and that earlier treatment is more beneficial.
Treatment chemistry, concrete composition, application quality, climate, and exposure all affect the outcome. These shorter laboratory and modeling studies explain the broader preservation mechanism but do not turn test cycles into field years. The CMT and Iowa State work below provides the product-specific laboratory comparisons currently available for SIP-1133™.
Why application chemistry matters for people and waterways
SIP-1133™ uses soybean-oil-derived acrylated epoxidized soybean oil, or AESO. Published research found that cured AESO formulations degraded under tested enzymatic and oxidative in vitro conditions, and separate AESO biomaterial research showed low toxicity in in vitro studies. Those findings support a bounded claim about the active chemistry; they are not a whole-product environmental-fate test or a claim that SIP-1133™ is harmless.
- Sibilia and colleagues (2024) evaluated degradation of pure AESO and an AESO composite under enzymatic and oxidative in vitro conditions.
- Mondal and colleagues (2021) evaluated AESO-based nanocomposite scaffolds, including in vitro toxicity testing.
Penetrating concrete sealers do not all bring the same handling hazards to a job. The current SIP-1133™ safety data sheet describes a water-based emulsion with no odor, a 599°F flash point, and non-dangerous-goods status for U.S. DOT transport. It still calls for gloves and eye protection, avoiding spray mist, and preventing the product from entering drains.
For a concrete-specific silane comparison, Sika identifies Sikagard®-705 L as a 99% active silane penetrating treatment. Its November 2023 safety data sheet classifies the product as a Category 3 flammable liquid, reports a 108°F flash point and 328 g/L VOC, and requires ignition-source control, grounding and bonding, explosion-proof equipment, and non-sparking tools. The SDS also says to prevent spills from reaching soil, drains, sewers, rivers, lakes, and waterways.
A second manufacturer example shows why the distinction is broader than one product. Pecora identifies KlereSeal® 9100-S as a 100% silane concrete and masonry sealer. Its August 2020 safety data sheet classifies the product as a combustible liquid and skin irritant, reports a 149°F flash point and 329 g/L VOC, and says not to let undiluted product or large quantities reach groundwater, water courses, or sewage systems.
These product-to-product SDS comparisons support a substantially simpler documented fire and vapor-control profile for SIP-1133™. The distinction matters for smaller DIY-scale projects, where industrial controls may be less familiar, and for bridge-deck work over water, where overspray and spill recovery are especially consequential. It is not a claim that SIP-1133™ is harmless or may be released to the environment. SIP-1133™ can sensitize skin and irritate eyes, and every project still needs PPE, wind and overspray controls, containment, and responsible cleanup.
VOC content also matters beyond the immediate work zone: the U.S. Environmental Protection Agency explains that VOCs can react with nitrogen oxides to form ground-level ozone. Commercial silane formulations vary, so the Sikagard®-705 L figures should be read as one relevant market comparison—not a statement about every silane sealer.
Who is CMT?
Construction Materials Testing is a Des Moines materials laboratory founded in 2001. The company specializes in Portland cement concrete, asphalt, aggregates, geotechnical work, and other construction-material tests. Its website lists AASHTO, CCRL, and U.S. Army Corps of Engineers laboratory accreditations, along with technician certifications from organizations such as ACI and the Iowa DOT.
For SoyLei Project 261121SOY, CMT made the concrete specimens in its laboratory, cured them, ran the freeze-thaw chamber work, recorded the measurements, and issued the report. The testing was performed outside SoyLei’s own laboratory and included an untreated control plus named commercial comparators. That makes the report useful third-party comparative data. CMT describes the work as conducted in general accordance with ASTM C666; SoyLei is not representing that this specific method falls within a particular accreditation scope.
What 180 cycles showed
CMT followed the specimen sets through the final recorded 180-cycle point. Two measurements are especially helpful for understanding the result.
Mass loss
Mass loss tells us how much material a specimen lost during the test. At 180 cycles, the untreated control recorded 7.96% mass loss. A SIP-1133™ test series recorded 4.55% mass loss. SoyLei’s calculation puts that result 42.9% below the untreated control.

| Specimen series | Mass loss | Comparison |
|---|---|---|
| Untreated control | 7.96% | Control |
| SIP-1133™ test series | 4.55% | 42.9% less than untreated, calculated by SoyLei |
Relative dynamic modulus
Relative dynamic modulus tracks how much of a specimen’s starting stiffness response remains as cycling continues. In plain language, a lower percentage means that internal freeze-thaw damage has reduced more of the concrete specimen’s original stiffness response. One SIP-1133™ test series retained 60.16% at 180 cycles.

What the full modulus curve adds
The final value is only one point on the curve. Looking at every recorded 30-cycle checkpoint shows when the rate of stiffness loss changed.
| Specimen series | 0 | 30 | 60 | 90 | 120 | 150 | 180 |
|---|---|---|---|---|---|---|---|
| Untreated control | 100.00% | 94.49% | 92.65% | 88.81% | 78.13% | 75.29% | 64.50% |
| Pavix | 100.00% | 97.60% | 86.08% | 73.14% | 70.27% | 66.91% | 64.67% |
| Premier Repel | 100.00% | 94.66% | 89.57% | 85.63% | 81.42% | 62.17% | 52.45% |
| SIP-1133™ 15% development series | 100.00% | 97.02% | 90.56% | 84.66% | 75.92% | 60.08% | 52.95% |
| SIP-1133™ 22.5% development series | 100.00% | 96.01% | 93.04% | 88.23% | 82.21% | 63.61% | 60.16% |
Delayed damage acceleration: at 120 cycles, the tested 22.5% SIP-1133™ series retained 82.21% average relative dynamic modulus—the highest observed average among the five groups at that checkpoint—and had accumulated the smallest decline from its starting value, 17.79 percentage points. Its largest observed 30-cycle decline came later, from 120 to 150 cycles, when RDM fell 18.60 points. Before cycle 120, no interval for that series lost more than 6.02 points.
The tested 15% SIP-1133™ series showed the same timing pattern: its largest observed interval loss, 15.84 points, occurred from 120 to 150 cycles. These findings support saying that both tested SIP-1133™ development formulations delayed their steepest observed modulus loss until the 120–150-cycle interval. Premier Repel’s steepest decline also occurred in that interval; Pavix’s occurred earlier, from 60 to 90 cycles; and the untreated control followed a more irregular path.
After 150 cycles, the measured loss slowed to 3.45 points for the 22.5% series and 7.12 points for the 15% series. That slowdown is consistent with a saturating damage trajectory after the large 120–150-cycle loss: it does not erase the rapid-loss interval or suggest that the specimens recovered. Freeze-thaw research commonly describes nonlinear, staged damage as pore saturation, microcracking, and connected damage evolve. With only 30-cycle checkpoints and one interval after cycle 150, however, this data set cannot identify the physical cause of the slowdown by itself.
These values are laboratory measurements, not a calendar for the pavement. Concrete mix, condition, drainage, salt exposure, traffic, workmanship, and weather all influence what happens in the field.
What the Iowa State PCC scaling work showed
This was internal, unpublished testing conducted in 2021 in Iowa State University’s CCEE Structures Laboratory under Professor Christopher Williams. It was not a peer-reviewed publication or an institutional endorsement.
The PCC scaling study used three untreated specimens and three SIP-1133™ treated specimens. The concrete was cured for fourteen days in a lime-activated bath, exposed to a salt solution, and cycled through freezing and thawing. Because the available beams constrained the specimen size, the exposed surface area was 48 square inches rather than the 72 square inches specified in ASTM C672. That difference matters when comparing this work with a full standard test.
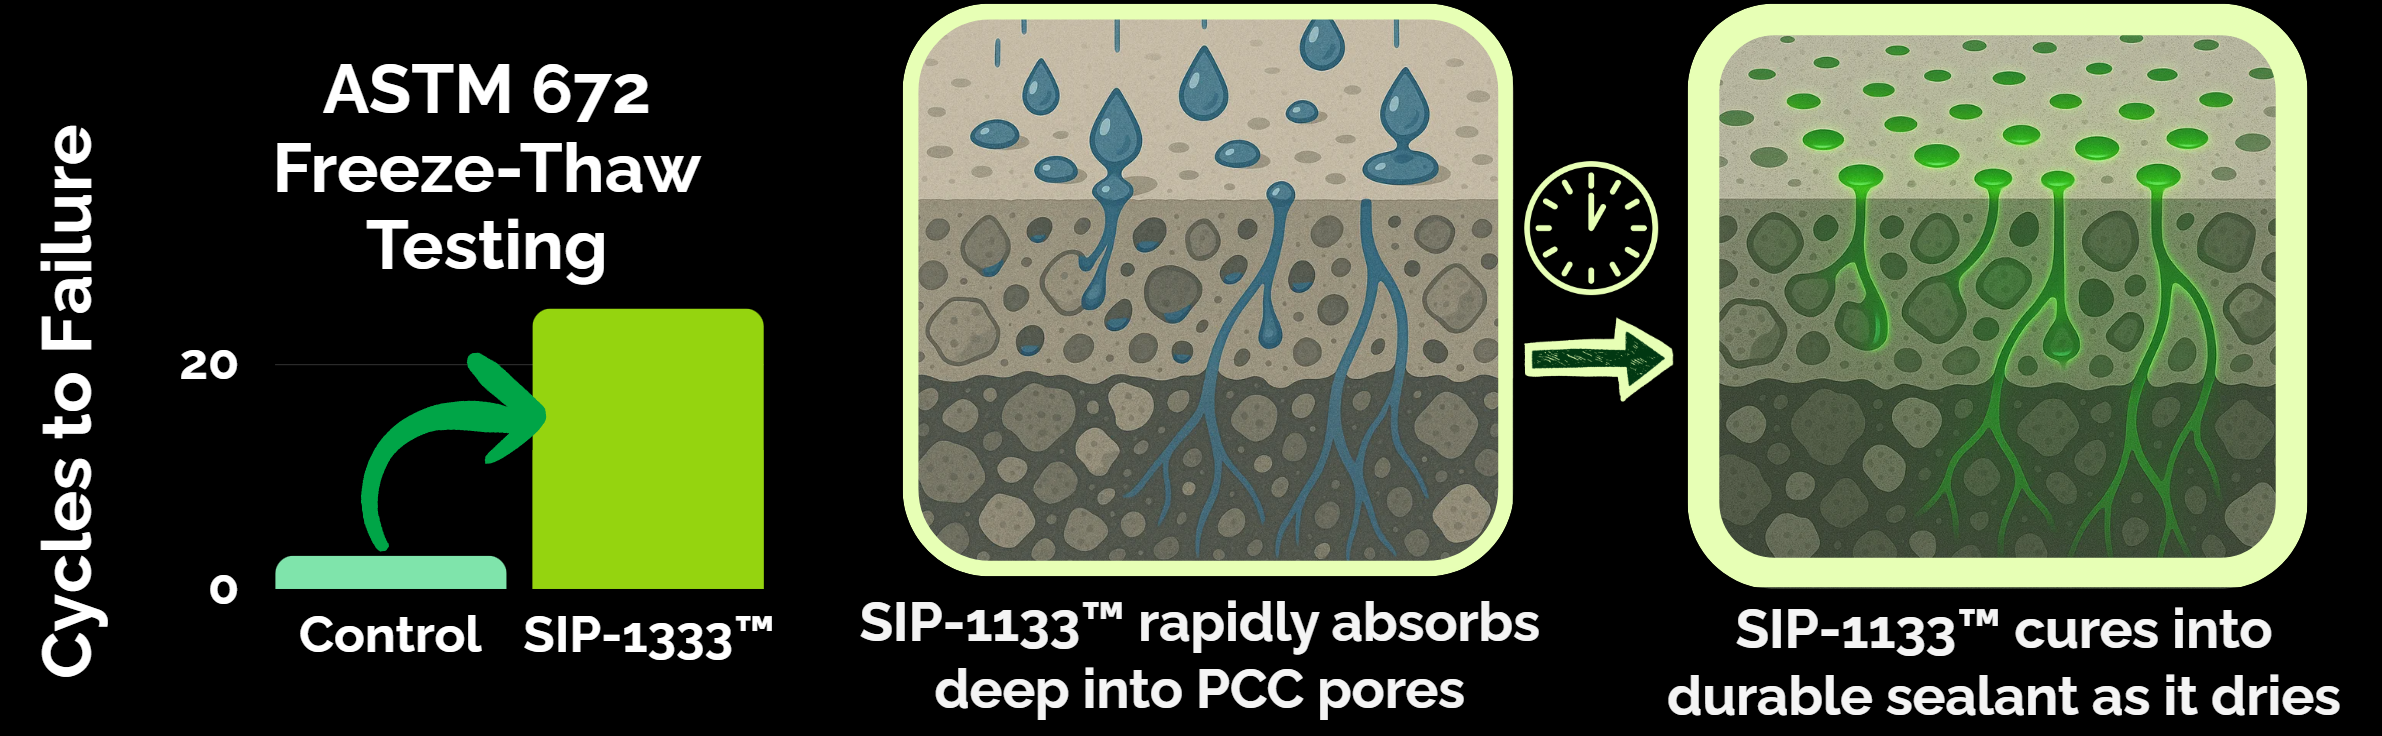
The untreated specimens failed after one to three cycles. The treated specimens lasted from fifteen to more than twenty-one cycles. After eighteen cycles, two treated specimens had no visible scaling and one had minor surface scaling. One treated specimen continued past twenty-one cycles.

| Specimens | Reported cycle result | Observation at 18 cycles |
|---|---|---|
| Untreated control | Failed after 1–3 cycles | Already failed |
| SIP-1133™ treated | 15–21+ cycles | Two with no visible scaling; one with minor scaling |
This was a small comparative study with modified specimen geometry. It supports continued evaluation and project planning. Larger standard-size studies and field monitoring would strengthen the picture.
Where the patent and Page County fit
SIP-1133™ uses acrylated epoxidized soybean-oil technology covered by U.S. Patent No. 12,297,150. The USPTO examined the claimed invention for utility, novelty, and non-obviousness. The patent is the primary source for the protected technology; patent issuance is not an endorsement of product efficacy, safety, environmental benefit, or field life.
The Page County, Iowa hero video shows SIP-1133™ being applied on a real field project. It is useful application context, including project scale and spray work. Long-term performance should come from documented field monitoring rather than visual impressions from a project video.
What to ask before treating concrete
- Is the concrete sound, clean, dry, and free of a coating that would block penetration?
- Are cracks, spalls, drainage problems, or structural repairs needed first?
- Can the work happen at 40°F and rising, with dry weather and manageable wind?
- What traffic control, friction check, and reopening criteria does the project require?
- How will the team document the treated area and monitor it after application?
The SIP-1133™ application brochure covers candidacy, safety, weather, and spray planning. The product flyer gives a concise view of the field application and product benefits.
Contact us to order SIP-1133™ directly. We’re also available if you would like help estimating coverage, checking application requirements, or planning a larger or unusual project.
Methods, unit interpretation, and statistical limits
CMT reported three specimens per group at 0, 30, 60, 90, 120, 150, and 180 cycles. SoyLei transcribed the three specimen values from the supporting workbooks and independently reproduced each workbook average. Interval loss is the earlier checkpoint’s average RDM minus the next checkpoint’s average RDM. “Steepest observed loss” means the largest of those six 30-cycle differences; it is an interval description, not a claim that the exact onset occurred on cycle 120.
The underlying CMT report and workbooks label the specimen readings “dynamic modulus.” Their cycle-zero values range from 39.0 to 49.4, a scale consistent with concrete modulus reported in gigapascals—not with raw prism resonance, which is ordinarily reported in hertz and is commonly in the thousands. For comparison, an FHWA concrete characterization report reports modulus values in the tens of GPa and transverse prism resonance around 2,400–2,650 Hz. ASTM C215 explains that measured resonant frequencies are used to calculate dynamic modulus. SoyLei therefore treated CMT’s readings as already-converted modulus and reproduced the workbook formula: current modulus divided by initial modulus, multiplied by 100. If the source cells had instead contained raw resonant frequency, ASTM C666’s squared-frequency ratio would apply; squaring CMT’s already-converted modulus ratio would apply that conversion twice.
This is a descriptive analysis of a small laboratory data set, with three specimens per group and seven measurement times. No treatment assignment protocol or prespecified change-point analysis was supplied, and the report does not provide observations after 180 cycles. The 22.5% series’ 82.21% average at cycle 120 was the highest observed group mean, but that does not establish statistical superiority or predict a field service-life extension. The full curve also shows that Pavix and the untreated control finished slightly above the 22.5% SIP-1133™ series at cycle 180.
Original sources and further reading
- Construction Materials Testing, Project 261121SOY, “ASTM C 666 Freeze/Thaw,” June 19, 2026, with five supporting workbooks. These client report files are the original source for the CMT values but are not publicly hosted; the laboratory’s public site is cmt-iowa.com.
- FHWA, Freeze-Thaw Resistance of Concrete With Marginal Air Content, Chapter 2, for the ASTM C666 relative-dynamic-modulus calculation from raw resonant frequency.
- FHWA-HRT-06-103, Material Property Characterization of Ultra-High Performance Concrete, for concrete modulus and resonant-frequency examples and the relationship between resonance loss, RDM, and internal microcracking.
- Liu et al., Materials 14 (2021), 6568, for experimental links among freeze-thaw cycling, declining relative dynamic modulus, increasing porosity, and growth of meso- and macropores.
- Zhou et al., Case Studies in Construction Materials 20 (2024), e03305, for a damage-velocity analysis that separates freeze-thaw deterioration into rapid-growth, rapid-reduction, and slow-attenuation stages.
- The internal SIP-1133™ Technical Note describing the 2021 Iowa State University CCEE Structures Laboratory PCC scaling work under Professor Christopher Williams, the current SIP-1133™ SDS, U.S. Patent No. 12,297,150, and the Page County project video.
Additional sources: Xiao et al., Journal of Performance of Constructed Facilities (2022); Brem et al., MATEC Web of Conferences 364 (2022), 04005; Pritzl et al., Construction and Building Materials 101 (2015), 580–589; Li et al., Materials 13 (2020), 5361; Liu et al., Materials 17 (2024), 5755; Zeng et al., Construction and Building Materials 249 (2020), 118802; Sibilia et al., BioMed Research International (2024); Mondal et al., Materials Science and Engineering: C (2021); representative Sika and Pecora silane-sealer SDSs; and U.S. EPA ground-level-ozone guidance. Field studies of other chemistries do not establish a SIP-1133™ lifespan. Laboratory results do not predict an exact field service life. Safety comparisons apply to the cited products and SDS revisions.